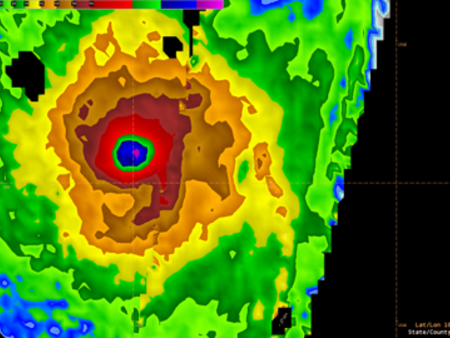
Super Typhoon Hagibis 4 Oct-13 Oct 2019
Successive Interecepts of Super Typhoon Hagibis and associated SMOS wind speed retrieval along the storm tracks. The wind radii at 34, 50 and 64 kt are indicated in each plot
Typhoon Hagibis was an extremely violent and large tropical cyclone that caused widespread destruction across its path, starting from October 6 up until October 13. The 38th depression, 9th typhoon and 3rd super typhoon of the 2019 Pacific typhoon season, it was the strongest typhoon in decades to strike mainland Japan; and one of the largest typhoons ever recorded at a peak diameter of 825 nautical miles (950 mi; 1529 km) It was also the costliest Pacific typhoon on record, surpassing Typhoon Mireille's record by more than US$5 billion (When not adjusted for inflation)[1]
Hagibis developed from a tropical wave located a couple hundred miles north of the Marshall Islands on October 2. The Joint Typhoon Warning Center issued a red tropical cyclone formation alert - noting that the disturbance could undergo rapid intensification upon being identified as a tropical depression. On the next day, October 3, both the Japanese Meteorological Agency and the Joint Typhoon Warning Center began issuing advisories on Tropical Depression 20W.
The depression stayed at the same intensity as it travelled west toward the Mariana Islands on October 4, but on October 5, 20W began undergoing rapid intensification and early that day, the system was issued with the name "Hagibis" by the JMA, which means speed in Filipino. Sea surface temperatures and wind shear became extremely favourable for tropical cyclogenesis and Hagibis underwent explosive intensification on October 6, and became a category 5 super typhoon in under 12 hours - the second of the 2019 Pacific typhoon season. Edging closer to the uninhabited areas of the Mariana Islands, Hagibis displayed excellent convection as well as a well defined circulation. The system developed a pinhole eye and made landfall on the Northern Mariana Islands, at peak intensity with 10-minute sustained winds of 195 km/h (120 mph) and a central pressure of 915 hPa (27.02 inHg).
Land interaction did not affect Hagibis too much, but as the system continued to mature, it underwent an eyewall replacement cycle, which is usual for all tropical cyclones of a similar intensity. The inner eyewall was robbed of its needed moisture and Hagibis began to weaken, but it formed a large and cloud-filled eye, which then became clear and it reached its second peak. Travelling toward Japan, Hagibis encountered high vertical wind shear and its inner eyewall began to degrade, and the outer eyewalls rapidly eroded as its center began to be exposed. On October 12, Hagibis made landfall on Japan at 19:00 p.m JST (10:00 UTC) on the Izu Peninsula near Shizuoka. Then, an hour later at 20:00 p.m. JST, (11:00 UTC), Hagibis made its second landfall on Japan in the Greater Tokyo Area. Wind shear was now at 60 knots (69 mph; 111 km/h), and Hagibis' structure became torn apart as it sped at 34 knots (39 mph; 63 km/h) north-northeast toward more hostile conditions. On October 13, Hagibis became an extratropical low and the JMA and JTWC issued their final advisories on the system. Hagibis caused catastrophic destruction across much of eastern Japan. A large tornado also struck the Ichihara area of Chiba Prefecture.
As of October 13, 30 people have been confirmed dead and 15 missing in Japan.
SMOS and SMAP coherent views of Hagibis wind field on the 9th October 2019
Surface wind speed retrieved from a) SMAP data and b) SMOS data as the satellite swaths intercepted Typhoon Hagibis on 9 November 2019 at 0836 UTC and 0834 UTC, respectively. c) Merged SMOS+SMAP surface wind field. The wind speed contours at 34-kt (thick blue curve), 50-kt (red thick curve) and 64-kt (magenta curve) are superimposed with the background wind fields.. The thin color circles indicate radii ranging from storm center to 1000 km and are provided every 100 km.
These two quasi-simultaneous aquisitions from SMOS and SMAP reveal a strong coherency between the retrieved and estimated surface wind speed as retrieved from both sensors.
In addition, the satellite derived wind-radii can be compared to ATCF forecast and help in fixing potential mis-matches:
Plot courtesy of B. Sampson from NRL showing the ATCF 34-kt wind radii (magenta/red sectorial circles) over the surface wind from combined SMOS and SMAP. The pale orange color indicate the 34 kt level from the L-band radiometers


